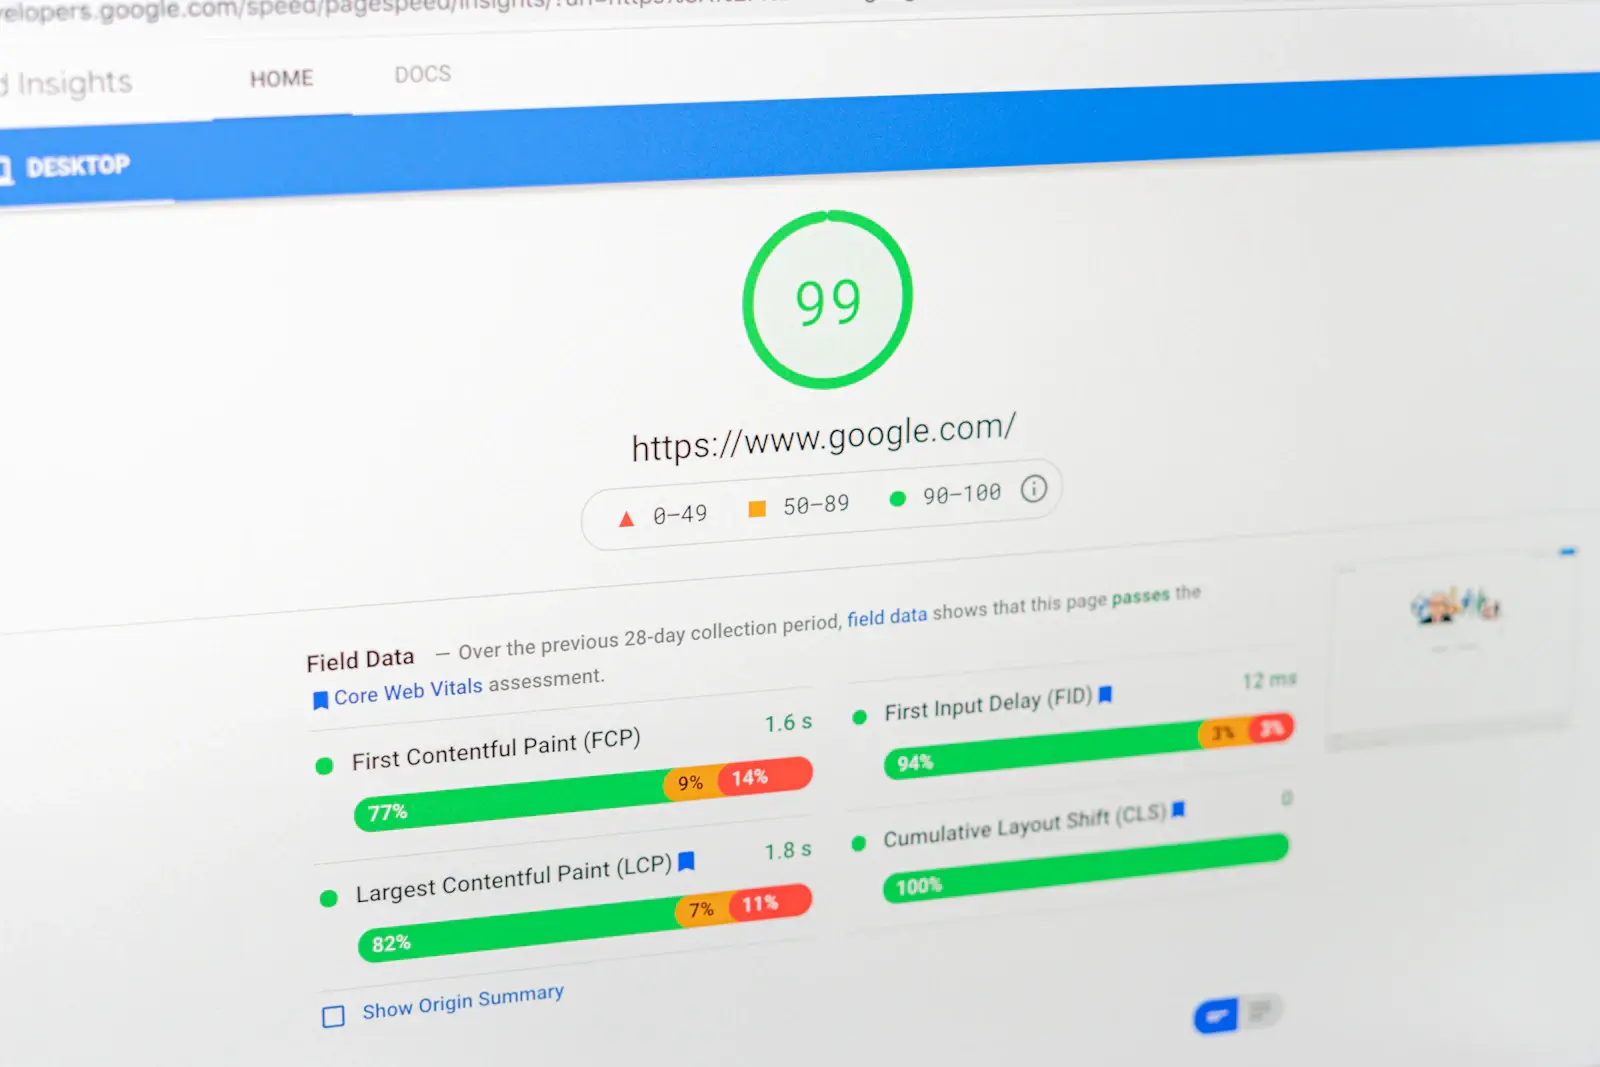

Google PageSpeed Insights is a free Google tool that analyzes the speed and performance of a web page on smartphones and computers. The service shows real-user results, runs a lab test and points out what is preventing the website from working faster.
According to the Deloitte Digital study Milliseconds Make Millions, a 0.1-second improvement in mobile site speed was accompanied by an 8.4% increase in conversions among the retailers studied.
In this article, we explain how to use PageSpeed Insights, read the report correctly, evaluate Core Web Vitals and determine which technical issues need to be fixed first.
In Brief
- A PSI report has 2 parts: field data (real users over 28 days) and lab data (a single Lighthouse test run). Real-user data is more important for SEO decisions.
- The 0–100 score is a lab metric. Users don’t see it, and for Core Web Vitals Google looks at LCP, INP and CLS.
- Good thresholds: LCP up to 2.5 s, INP up to 200 ms, CLS up to 0.1 at the 75th percentile of page loads.
- The most common causes of a slow page: heavy images, render-blocking scripts, slow server response and unnecessary third-party widgets.
- Start with the LCP element and caching: these are the quickest fixes with visible results.
Contents
- What PageSpeed Insights is and what it measures
- How to check website speed in PageSpeed Insights: step by step
- Core Web Vitals metrics in the report
- How to read the recommendations: Opportunities and Diagnostics
- How to fix common issues
- A real example: how a website reached 32,000 users per month
- Why the PageSpeed Insights score changes
- PageSpeed Insights alternatives
- Does speed affect SEO and rankings?
- Speed optimization checklist
- Common optimization mistakes
- Conclusion
- FAQ: frequently asked questions
What PageSpeed Insights Is and What It Measures
Google PageSpeed Insights (PSI) is an online service at pagespeed.web.dev for analyzing the performance of an individual web page. It evaluates the page in four areas: Performance, Accessibility, Best Practices and SEO.
For speed analysis, the main section is Performance. It contains lab metrics, real-visitor results when there is enough data, and technical recommendations.
The tool uses two data sources:
- Chrome User Experience Report (CrUX) – aggregated statistics on how pages perform on real Chrome users’ devices.
- Lighthouse – an automated test that checks the page under controlled conditions and finds possible causes of poor performance.
Combining this data helps you understand whether the website is really slow for visitors and which technical factors may be causing it.
Lab data (Lighthouse) vs Field data (CrUX)
Lab test results and real-user results may differ. This is due to the measurement conditions: Lighthouse tests the page using a defined scenario, while CrUX collects statistics from various devices and networks.
| Parameter | Lab data | Field data |
|---|---|---|
| Source | Lighthouse, a single test run | CrUX, real Chrome users |
| Period | The moment the test is run | A rolling 28-day window |
| Conditions | Emulated device and network (a mid-range phone for mobile) | Various devices, networks and countries |
| Purpose | Debugging: you can repeat it and compare before and after a fix | Assessing real experience and a signal for Google |
| Limitations | Doesn’t see real users, the result fluctuates | Requires enough traffic, updates with a delay |
| What it shows | A 0–100 score, metrics, recommendations | LCP, INP, CLS, FCP, TTFB from real visits |
If there is not enough data for a specific URL, PSI may show statistics for the corresponding origin. If there is none there either, the real-data block will be empty. This happens on new and low-traffic websites. CrUX also only collects statistics for publicly accessible pages with enough data from Chrome users.
Use lab data to find technical issues and field data to assess how the page performs for real audiences. It is especially important to compare field metrics after significant changes to the website, as they are not updated instantly.
Why the 0–100 Score Doesn’t Equal Speed for the User
After testing, Google PageSpeed shows an overall performance score in points and color:
- 90–100 (green) – good performance;
- 50–89 (orange) – needs improvement;
- 0–49 (red) – poor performance.
This is a Lighthouse lab result calculated from five metrics. According to Chrome documentation, their weights are as follows:
| Metric | Weight in the score |
|---|---|
| Total Blocking Time (TBT) | 30% |
| Largest Contentful Paint (LCP) | 25% |
| Cumulative Layout Shift (CLS) | 25% |
| First Contentful Paint (FCP) | 10% |
| Speed Index (SI) | 10% |
INP is not part of the score because it is a field metric. For lab diagnostics of interaction delays, TBT is used as a supporting metric. A low TBT usually correlates with a low INP but cannot replace it.
So 95 points in Lighthouse doesn’t mean the website is fast for all users. Conversely, a score of 70 doesn’t necessarily indicate poor Core Web Vitals in field data.
Don’t optimize a website just for the maximum score. It is much more useful to check whether the main content appears quickly, whether the page responds to clicks and whether elements shift during loading.
The Lighthouse engine in PageSpeed Insights is also periodically updated, and testing and scoring conditions may change with it. So compare results taking into account the date, tool version and test parameters.
How to Check Website Speed in PageSpeed Insights: Step by Step
To check website speed, open PageSpeed Insights. You can find the service by name or by searching Google Speed Test, and all you need for analysis is the page address.

- Open pagespeed.web.dev.
- Paste the full page address with https. Check not only the home page but also a category page, a product page and an article separately.
- Click “Analyze”. The test usually takes up to a minute.
- Switch between the Mobile and Desktop tabs. Start with mobile: the conditions are stricter there, and it usually reveals the problems.
- The top block with real data has a “This URL” / “Origin” switch. The first shows data for a single page, the second for the entire domain.
- Below you can see whether the Core Web Vitals assessment has passed, and circles with scores by category.
- The “Diagnose performance issues” block contains lab metrics and a list of recommendations. You can filter them by metric (FCP, LCP, TBT, CLS) to see only those related to a specific indicator.
Block names depend on the interface language and service version, so they may differ for you.
Before making changes, create a table with baseline values (score, LCP, INP, CLS, TTFB) separately for mobile and desktop on 3–5 typical pages. Without this, a week later you won’t know what exactly improved. This is the basis for any website speed check. If you need comprehensive diagnostics, the LuxSite team will carry out an SEO audit of your website and prioritize fixes.
Core Web Vitals Metrics in the Report
Core Web Vitals are three key metrics Google uses to evaluate how fast the main content is displayed, how the page responds to user actions and how stable its elements are. They are LCP, INP and CLS. In addition, PageSpeed Insights shows supporting metrics that help identify the causes of problems.
| Metric | What it means | Good | Needs improvement | Poor |
|---|---|---|---|---|
| LCP (Largest Contentful Paint) | When the largest visible element appeared: an image, text block or video poster | up to 2.5 s | 2.5–4 s | over 4 s |
| INP (Interaction to Next Paint) | The delay between a click, tap or key press and the next frame | up to 200 ms | 200–500 ms | over 500 ms |
| CLS (Cumulative Layout Shift) | How much elements “jump” during loading | up to 0.1 | 0.1–0.25 | over 0.25 |
| FCP (First Contentful Paint) | When the first content appeared | up to 1.8 s | 1.8–3 s | over 3 s |
| TTFB (Time to First Byte) | How long the server takes to deliver the first byte | up to 0.8 s | 0.8–1.8 s | over 1.8 s |
| TBT (Total Blocking Time) | Total main thread blocking time (lab metric) | up to 200 ms | not defined | not defined |
Thresholds according to web.dev: LCP up to 2.5 s, INP up to 200 ms, CLS up to 0.1. A page is considered to pass the assessment if all three metrics are good at the 75th percentile of page loads, separately for mobile and desktop. FCP and TTFB help analyze loading, and TBT is used in lab tests. If you want to read more about this group of metrics, we have a separate article on Core Web Vitals factors.
LCP: What It Is and How to Improve It
LCP (Largest Contentful Paint) shows how long it takes to display the largest element in the visible part of the page. This can be the main product image, a banner, a large text block or a video poster. Candidates include <img>, images inside SVG, a <video> poster, elements with a CSS url() background and text blocks. A good LCP is up to 2.5 seconds.
A useful technique: to find the cause of the delay, break LCP down into 4 components:
- TTFB – the time waiting for the first server response.
- Resource load delay – the time until the browser starts receiving the LCP resource.
- Resource load duration – the time it takes to transfer the resource.
- Element render delay – the gap between receiving the resource and its appearance on screen.
According to web.dev recommendations, for optimized LCP loading the approximate time distribution is: TTFB about 40%, load delay less than 10%, resource transfer about 40%, render delay less than 10%. These are diagnostic guidelines, not mandatory standards.
What to do to improve LCP:
- Find the LCP element in the Lighthouse report and check what exactly delays its appearance.
- If it is an image, optimize its size and format and use WebP or AVIF.
- For an important image, set fetchpriority=”high” if needed and don’t use loading=”lazy” so as not to delay its loading.
- If TTFB is high, check server caching, hosting speed and whether a CDN makes sense.
- If the resource has already loaded but is not displayed, check render-blocking CSS and JavaScript.
This way you eliminate the cause of the delay instead of optimizing everything indiscriminately.
INP Replaced FID: What It Is
INP (Interaction to Next Paint) measures how quickly a website visually responds to user actions: clicks on buttons and links, key presses or interactions with forms. Scrolling, hovering and zooming are not counted. INP evaluates the slowest interactions during a page visit, taking into account the number of actions performed. In March 2024, this metric replaced FID (First Input Delay) as part of Core Web Vitals.
INP takes into account delays during interactions throughout the page visit, not just the first click. That is why it reflects the overall responsiveness of the interface better than the previous FID.
PSI does not show INP in the lab section because it requires real user actions. Instead, look at TBT and the “Reduce JavaScript execution time” and “Minimize main-thread work” sections.
Common causes of poor INP: heavy click handlers, large third-party scripts, a large number of elements on the page and synchronous operations on the main thread.
CLS: Layout Shifts
CLS (Cumulative Layout Shift) measures unexpected shifts of visible page elements. For example, a user wants to click a button, but an ad banner suddenly loads above it and pushes the content down. As a result, the person may click somewhere they didn’t intend to.
The most common causes of high CLS are images without set dimensions, ad blocks without reserved space, dynamically added content and layout changes after web fonts load.
To reduce CLS:
- specify width and height or aspect-ratio for images and videos;
- reserve space for banners, widgets and other dynamic content;
- don’t insert new blocks above content that is already displayed;
- check whether loaded web fonts change the position of text.
CLS is a unitless metric, so it is not measured in seconds. The lower the value, the more stable the interface.
How to Read the Recommendations: Opportunities and Diagnostics
After measuring the metrics, PageSpeed Insights shows technical recommendations. In older versions of Lighthouse, they were grouped into Opportunities and Diagnostics. Newer reports use the Performance Insights system, and the names of individual audits may differ, so focus on the meaning rather than the exact wording. Here are the 10 items that come up most often.
| What the report says (in essence) | What it means | What to do |
|---|---|---|
| Eliminate render-blocking resources | CSS and JS in <head> prevent the browser from displaying the page | Inline critical CSS, load the rest asynchronously; use defer for scripts |
| Properly sized images in modern formats | The file is larger than needed or in an outdated format | Compress, serve WebP/AVIF, use srcset. More details: how to compress images for a website |
| Defer offscreen images | Images outside the first screen load immediately | loading=”lazy” for everything below the first screen |
| Reduce unused JavaScript | Code is loaded that is not executed on the page | Remove unnecessary plugins, split bundles, load scripts only where needed |
| Reduce unused CSS | The same principle for styles | Remove unnecessary themes and libraries, split files by page |
| Efficient cache policy | Static files are not cached or cached for a short time | Cache-Control or Expires headers (example below) |
| Reduce server response time | High TTFB | Server cache, database query optimization, CDN, hosting upgrade |
| Avoid an excessive DOM size | Too many elements on the page | Simplify the layout, use pagination, virtualize long lists |
| Fonts: show text while loading | Text is invisible until the font loads | font-display: swap, preload the critical font, fewer font weights |
| Third-party script impact | Chats, widgets and pixels occupy the main thread | Load them deferred, remove unnecessary ones, check each one’s impact |
For example, if Lighthouse shows a high LCP because of the main banner, check how it loads first and only then optimize secondary icons or styles at the bottom of the page.
Priorities depend on the page: in a store, it is product photos and filters; on a corporate website, banners and third-party scripts. Also, don’t simply add up the time savings estimated by the service. Fixing one problem can affect others, so the actual result is determined by retesting.
If the check revealed many problems at once, identify their root cause. We cover the typical technical factors in our article why a website loads slowly.
Need an analysis of your report? We will look at the LCP element, server and scripts and draw up a prioritized fix plan. Submit a request for SEO promotion and a technical audit.
How to Fix Common Issues
After analyzing the report, the next step is to eliminate the issues that affect performance the most. Below are simple examples you can use as a starting point. Before making changes on a live website, make a backup and test the changes in a staging environment.

Browser Cache via .htaccess
The browser cache lets visitors reuse previously downloaded images, fonts and other static resources. This reduces the number of repeat requests on subsequent visits.
Suitable for Apache servers with the mod_expires and mod_headers modules enabled.
<IfModule mod_expires.c>
ExpiresActive On
ExpiresByType image/jpeg "access plus 1 year"
ExpiresByType image/png "access plus 1 year"
ExpiresByType image/webp "access plus 1 year"
ExpiresByType image/avif "access plus 1 year"
ExpiresByType image/svg+xml "access plus 1 year"
ExpiresByType font/woff2 "access plus 1 year"
ExpiresByType text/css "access plus 1 month"
ExpiresByType application/javascript "access plus 1 month"
</IfModule>
<IfModule mod_headers.c>
<FilesMatch "\.(jpg|jpeg|png|webp|avif|svg|woff2)$">
Header set Cache-Control "public, max-age=31536000"
</FilesMatch>
</IfModule>
Set a long cache lifetime for CSS and JS only if the file name contains a version or hash (style.a1b2c3.css). Otherwise, users won’t see updates. For nginx and other servers the syntax is different, so it is better to consult your administrator or the server documentation.
Text Compression
Many hosting providers already enable compression (gzip or Brotli) by default. Check the Content-Encoding header in the server response before adding a rule.
<IfModule mod_deflate.c>
AddOutputFilterByType DEFLATE text/html text/css application/javascript application/json image/svg+xml
</IfModule>
Preload and fetchpriority for the LCP Image
If the main image of the page loads with a delay, you can tell the browser that this resource has high priority. Don’t set this level for more than 1–2 images, otherwise it loses its meaning.
<head>
<link rel="preload" as="image" href="/img/hero.webp" fetchpriority="high">
</head>
<img src="/img/hero.webp" width="1200" height="600"
alt="Main page photo" fetchpriority="high">
If the browser takes a long time to discover the image, for example because it is loaded via CSS or JavaScript, you can also use preload. For a font used on the first screen, preload looks like this:
<link rel="preload" as="font" type="font/woff2"
href="/fonts/main.woff2" crossorigin>
Before preloading fonts, check whether they are really needed for the initial rendering of the page. Don’t preload all font files at once.
The crossorigin attribute is required for fonts, even when the file is on the same domain.
Lazy Loading: loading=”lazy”
Apply it to images and iframes below the first screen. Never to the LCP image.
<img src="/img/product-12.webp" width="600" height="600"
alt="Product" loading="lazy" decoding="async">
This reduces the initial load, especially on pages with many images. However, it should not be applied to the LCP image or other resources the user needs immediately after opening the page.
WebP and AVIF
Large image files often increase page load time. Optimization means choosing the right size, compressing without noticeable loss of quality and using modern formats.
With the <picture> element, you can offer the browser several formats:
<picture>
<source srcset="/img/banner.avif" type="image/avif">
<source srcset="/img/banner.webp" type="image/webp">
<img src="/img/banner.jpg" width="1200" height="500" alt="Banner">
</picture>
The browser will choose the first format it supports, and JPEG will remain the fallback. To convert JPEG to WebP, you can use the cwebp utility:
cwebp -q 80 banner.jpg -o banner.webpA quality of 75–85 usually gives a good balance between size and appearance, but check your images visually.
Scripts and Fonts
JavaScript can delay page rendering and the response to user actions. If a script is not needed for the initial HTML rendering, you can load it with the defer attribute:
<script src="/js/app.js" defer></script>
@font-face {
font-family: "Main";
src: url("/fonts/main.woff2") format("woff2");
font-display: swap;
}
For classic external scripts, defer lets the browser download the file without blocking HTML parsing and execute it after the document has been parsed. And font-display: swap shows text in a fallback font while the main one is loading. Removing an unnecessary widget or library is sometimes more useful than minifying CSS and JavaScript.
WordPress
On WordPress, typical causes of poor performance are heavy themes, a large number of plugins, unoptimized images and a lack of effective caching.
What to do:
- Use a caching plugin and server-side page cache. Don’t install several optimization plugins at once: they conflict.
- Modern versions of WordPress add loading=”lazy” to images in the content. Check that your theme doesn’t also add it to the main banner.
- Remove unused plugins and themes. Each plugin can add its own CSS and JS to every page.
- Compress images on upload and serve WebP.
If you need help with updates, caching or fixing technical issues, see our article on WordPress technical support.
OpenCart
In OpenCart, performance often depends on the number of products, modules, catalog filters and the complexity of database queries.
- Enable caching and compression at the server level, and check the cache settings in the admin panel and in the modules you use.
- Check for a large number of modules and banners on the home page: catalogs often have more than needed.
- Optimize product images: resize them to the actual card dimensions and use WebP.
- Monitor slow database queries: on large catalogs, they are what drives TTFB up. More details in our article on OpenCart technical support.
Magento
Magento, including Adobe Commerce, is used for stores with complex catalogs, integrations and high load.
- Use production mode, the built-in full-page cache and an external cache (for example, Redis and Varnish) if your infrastructure allows it.
- In the developer settings, check JS and CSS merging and minification, but test after each toggle: on complex themes they can break the layout.
- Pay attention to third-party modules: they are the ones that add unnecessary requests.
- Complex cases require a developer.
A Real Example: How a Website Reached 32,000 Users per Month
During SEO promotion of the website of the uPVC window manufacturer Liniya Vikon, the LuxSite team carried out a technical audit and checked page load speed and server performance. After the first stage of optimization, the team tracked PageSpeed Insights metrics every month, including page load time and server response time. This made it possible to monitor performance after changes to the website’s code and functionality.
Result of comprehensive SEO promotion: according to Ahrefs, organic traffic grew from 7,000 to 32,000 users per month. The work lasted more than 12 months and included technical optimization, updating the structure and content, internal linking and link building.
Why the PageSpeed Insights Score Fluctuates and What to Do About It
Run the test twice in a row and you will most likely get different scores. This is normal for lab testing. Reasons for variability: network conditions, available client resources and competition for CPU resources.
What else affects the variation:
- Server. If the server response is unstable (shared hosting, peak load), TTFB and LCP fluctuate from run to run.
- Cache. Server cache warm-up: the first request may be slow, the following ones fast.
- CDN. Different node locations give different response times depending on where the test runs from.
- Dynamic content. Banners, A/B tests and ad blocks change the LCP element.
- Third-party scripts. Their response time doesn’t depend on you.
- Lighthouse updates. A new engine can change scores without any changes on the website.
What to do: run the test 3–5 times and take the median; don’t chase a green circle with a specific number, look at the trend. Compare metrics before and after fixes on the same day and from the same location. Most importantly, base decisions on field data and the Core Web Vitals report in Search Console, where there is no variation between individual runs.
PageSpeed Insights Alternatives
PageSpeed Insights is suitable for quick diagnostics of individual pages, but it doesn’t always let you pinpoint the exact cause of a delay. Here is the typical set of tools we use in our work:
| Tool | What it provides | When to use |
|---|---|---|
| Lighthouse in Chrome DevTools | The same engine as PSI but runs locally; you can test pages behind a login and local builds | Debugging before release |
| Core Web Vitals report in Google Search Console | Real data by groups of website pages: which URLs are poor and on which metric | Monitoring the entire website, finding problematic templates |
| Chrome DevTools: Performance tab | A detailed breakdown of what the main thread does and when | Finding the causes of a poor INP and long tasks |
| WebPageTest | Tests from different locations and on different devices, a request waterfall chart | In-depth analysis of resource loading |
| GTmetrix | Reports with change history and a choice of test location | Convenient monitoring and client reports (check plan terms on the service’s website) |
| CrUX (Chrome UX Report data) | Field data by origin and page, including via CrUX-based tools | Comparison with competitors, change history |
Combine tools: Search Console for monitoring, PSI for checking URLs and DevTools for diagnostics.
If you need to choose one alternative to Google PageSpeed, focus on the task: for a developer, Lighthouse in DevTools is more useful; for an SEO specialist, Search Console; and for in-depth analysis of network requests, WebPageTest.
A regular Google Speedtest helps check your internet speed but doesn’t explain why a page loads slowly. For that, use PageSpeed Insights, Lighthouse or WebPageTest.
Does Speed Affect SEO and Rankings?
In its Search documentation, Google calls Core Web Vitals metrics of real user experience and strongly recommends achieving good values. It also states that this aligns with what its core ranking systems seek to reward. The documentation does not specify exactly how much weight these signals carry for a particular query. So the honest answer is: speed won’t replace relevant content and links, but a slow website loses where competitors are roughly equal in content.
The direct effect of speed on behavior: fewer bounces, more page views and a higher conversion rate. For SEO as a whole, this means speed is part of the technical foundation, along with website structure, indexing and errors. We check all these elements during a comprehensive SEO audit.
Speed Optimization Checklist
Use this checklist after initial diagnostics or before launching an updated website.
Measurement
- Baseline PSI values (mobile and desktop) recorded for 3–5 typical pages
- Field data checked: for the page and for the entire website
- Core Web Vitals report in Search Console checked
- LCP element identified on key templates
Images
- Images are compressed and sized as needed for display
- WebP or AVIF is used with a fallback format
- Width and height (or aspect-ratio) are specified
- loading=”lazy” is set on images below the first screen
- The LCP image is not lazy-loaded and has fetchpriority=”high”
Scripts and Styles
- Scripts are loaded with defer or async
- Critical CSS is extracted, the rest is loaded without blocking
- Unused plugins, themes and libraries are removed
- Third-party widgets (chats, pixels) are deferred or removed
Fonts
- font-display: swap is set for fonts
- The first-screen font is preloaded, with no more weights than needed
Server and Cache
- Browser caching is set up for static files
- gzip or Brotli compression is enabled
- Server-side page cache is enabled, TTFB checked
- A CDN is connected for an international or regional audience
- After changes, metrics are measured again and compared with the baseline
Common Mistakes
Problems most often arise from the following decisions:
- Looking only at the single score and ignoring field data.
- Testing only the home page, although the problem is on product pages and articles.
- Setting loading=”lazy” on all images, including the LCP image.
- Installing several caching plugins at the same time.
- Adding long caching for CSS and JS without file versioning.
- Trying to reach 100 points at the expense of functionality the business needs.
- Not specifying image dimensions and getting layout shifts.
- Forgetting to measure the result again and compare it with the baseline.
Conclusion
Google PageSpeed Insights gives a clear picture if you read it correctly: real data for assessment, lab data for debugging. Start with the mobile version, find the LCP element, sort out images and caching, remove unnecessary scripts and check CLS. Then measure again and compare with the baseline.
Website loading speed should be monitored regularly, especially after design updates, new functionality or installing new modules. This helps keep the website user-friendly and detect issues that may affect conversion in time.
If PageSpeed Insights shows poor results and the cause is hard to determine, our specialists will help you carry out a technical audit, prioritize fixes and prepare recommendations for developers. Learn more about our approach on the SEO promotion page.
FAQ
What is PageSpeed Insights?
It is a free Google service that analyzes page speed on mobile and desktop. It shows real-user data from CrUX for 28 days, a Lighthouse lab test, LCP, INP and CLS metrics and a list of recommendations. It is available at pagespeed.web.dev, and no registration is required.
What score is considered good?
According to Google, 90–100 points is the green zone, 50–89 is orange and 0–49 is red. However, the score is a lab metric. For SEO, it is more important that, according to real data, LCP doesn’t exceed 2.5 s, INP 200 ms and CLS 0.1 at the 75th percentile of page loads.
Why is mobile lower than desktop?
The mobile test emulates a weaker device and a slower network, so scripts take longer to execute and resources load more slowly. In addition, heavier images are often loaded on mobile. A gap between mobile and desktop is normal, which is why optimization starts with the mobile version.
How does lab data differ from field data?
Lab data is the result of a single lab test of a page under controlled conditions. Field data is aggregated statistics from real Chrome users over the last 28 days. The former is used to diagnose technical issues, the latter to assess the actual user experience.
How do you speed up a WordPress website?
Enable one caching plugin and server-side cache, compress images and serve WebP, remove unused plugins, defer third-party scripts, and check hosting quality and TTFB. Don’t add loading=”lazy” to the main first-screen image. After each change, measure again in PSI.
Does speed affect rankings?
Yes. Google takes Core Web Vitals into account in its ranking systems, but high speed scores don’t guarantee higher rankings. Search results are also affected by content relevance, page quality and other signals. Performance optimization should primarily improve the user experience.